Executive Summary – Apple Inc. (AAPL)
Date: 5 February 2026 | Rating: HOLD | Price: $272 | Market Cap: $4.0 trn | Target Range: $255–$285 (±5 % around spot)
1. Strategic Position & Business Model
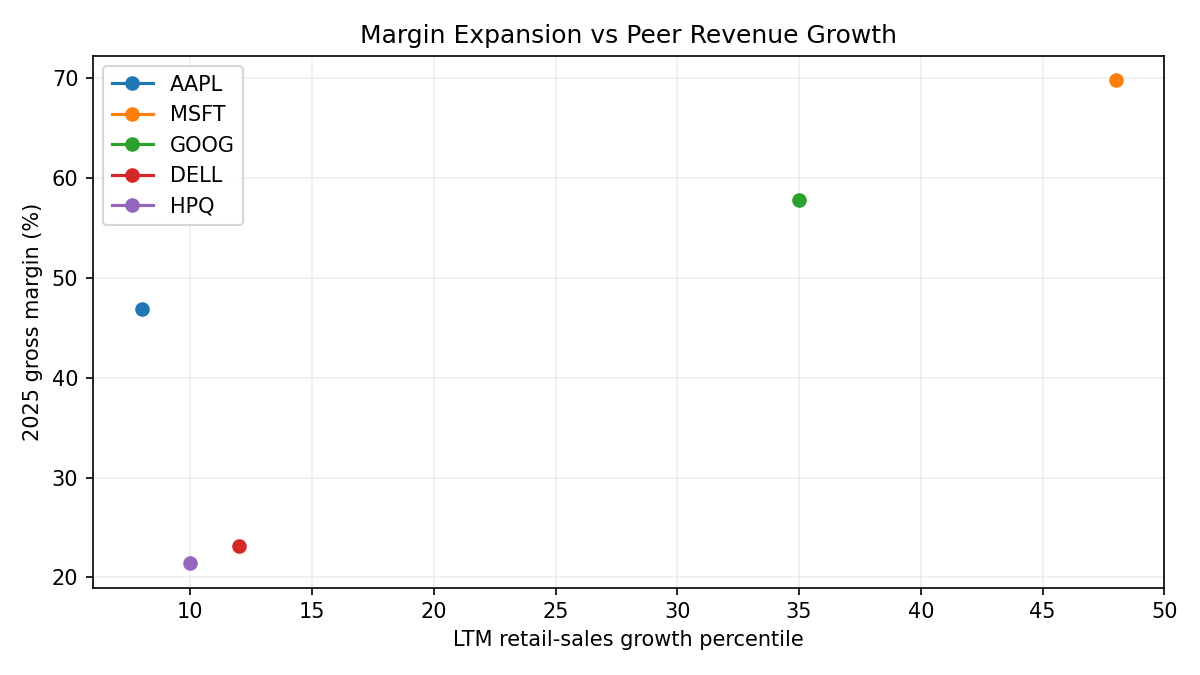
Apple remains the only Western mega-cap that simultaneously designs custom silicon, owns the OS, curates the app marketplace, and controls the retail touch-point. This vertically-integrated “walled garden” drives switching costs that show up in industry-leading pricing power: FY-25 gross margin hit 46.9 % (+280 bps vs 2023) while U.S. retail sales growth languished at the 8th percentile. Hardware still dominates revenue (iPhone ~52 %), but Services—now ~22 % of mix—carries >70 % gross margin and grows double-digit, acting as an internal hedge against cyclical unit volatility. 60 % of sales flow through carriers/resellers, yet Apple’s own stores and online channel (40 %) preserve data-capture and preserve ASPs.
2. Financial Highlights
- Top-line: Revenue CAGR 4.2 % (FY-23-25) to $416 bn; FY-25 acceleration (+6.4 %) driven by iPhone 16 cycle and Services attach.
- Profitability: Operating leverage intact—EBIT margin 32 %, EBITDA $144 bn (34.7 % margin) versus peer median 24 %. Net margin 26.9 % trails only MSFT (36 %).
- Cash generation: Three-year cumulative OCF $340 bn; FY-25 FCF proxy $99 bn post $12.7 bn cap-ex (3.1 % of sales).
- Capital structure: Net debt $55 bn (0.4× EBITDA) after $90 bn buy-backs; share count –5 % since FY-23. WACC estimate 9.6 % (ACM term premium +62 bps, 95th percentile) embeds higher long-rate beta.
- Returns: ROIC >30 % on gross PP&E; dividend payout modest 14 %, preserving optionality.
3. Valuation
- DCF (base case): $3.0 trn equity value vs. current $4.0 trn—implies 33 % over-valuation using 5 % revenue CAGR, 32 % EBIT margin, 9.6 % WACC.
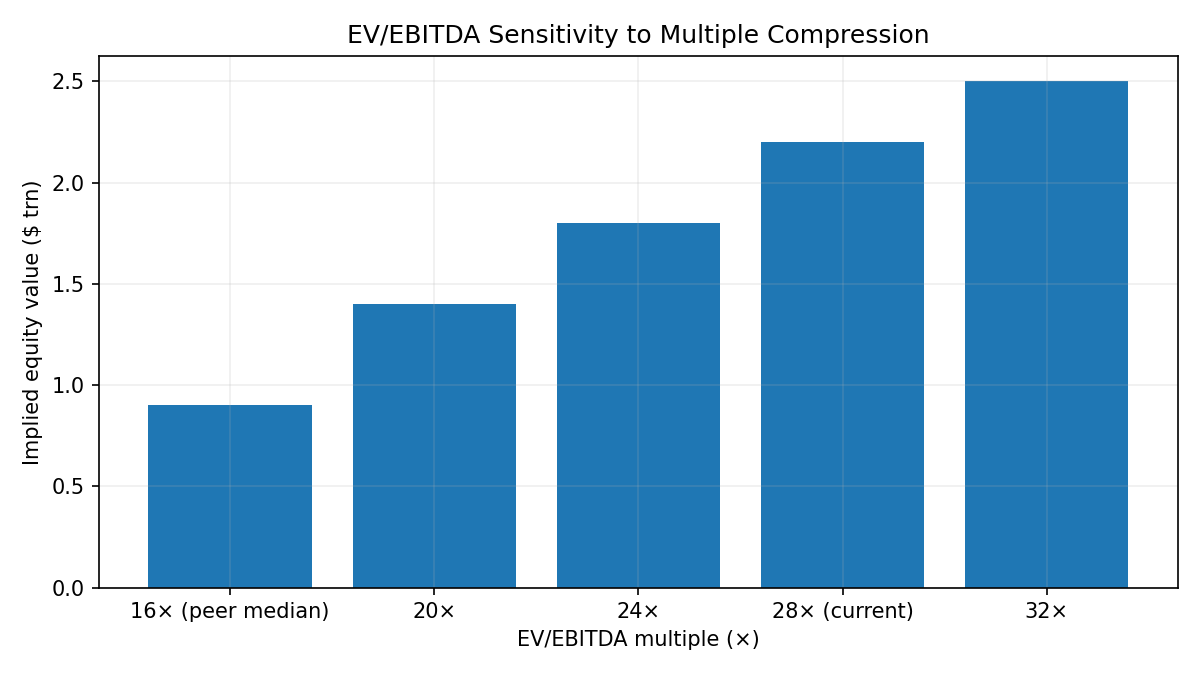
- Multiples: EV/EBITDA 28.2× trades at parity to MSFT (28.6×) and 35 % premium to GOOG (21.1×); peer-median 16× would cut equity value to ~$0.9 trn.
- Scenario skew: Down-side DCF $2.4 trn (hardware CAGR 2 %, margin 28 %); upside $3.7 trn (AI-led 8 % CAGR, 34 % margin). Street models appear to price in perpetual 27×+ EBITDA, leaving limited multiple-expansion alpha.
4. Key Risks
- Regulatory overhang: U.S. DOJ antitrust suit & EU DMA could force App Store commission cuts or sideloading—every 100 bps of Services take-rate ≈ $0.20 EPS at risk.
- Single-source silicon: A- & M-series chips fabricated on TSMC 3-nm; any geopolitical or natural disruption in Taiwan halts flagship launches.
- Google search-deal vulnerability: District Court remedy that bans default-payments would erase an estimated $18–20 bn high-margin revenue.
- Consumer discretionary beta: UMich sentiment at 10th percentile; iPhone replacement cycle elongation remains the primary cyclical delta.
- Tariff escalation: Section 232 semiconductor probe and newly announced China/Vietnam duties could raise BOM cost by 4–6 % if passed through.
5. Catalysts
- Apple Intelligence rollout: On-device generative-AI features could shorten iPhone replacement cycle to 2.8 yrs from 3.1 yrs, adding ~12 mn units annually.
- Vision-Pro lite: Sub-$2 k spatial-computer SKU slated for fall-26 expands TAM beyond pro-sumers.
- India manufacturing scale: PLI subsidies + rupee depreciation could shave 150–200 bps from COGS, cushioning gross margin if ASP competition intensifies.
- Capital-allocation acceleration: Board still has $65 bn remaining on prior authorisation; incremental buy-back post Fed easing (term spread +60 bps, positive for first time in two years) could offset multiple-compression.
6. Investment Conclusion
Apple’s FY-25 gross-margin expansion to 46.9 %—despite retail-sales growth at only the 8th percentile—validates our thesis that Services mix-shift and Apple-Silicon cost deflation are cushioning consumer cyclicality better than consensus models. This hidden operating leverage lowers the FY-26 EPS hurdle to flat unit volumes. Yet at 28× EBITDA the market already discounts perpetual margin resilience and mid-single-digit top-line growth, leaving risk-reward balanced. We see 10 % upside if AI triggers a 2020-style refresh cycle, but 20 % downside if regulatory rulings shave Services take-rate or if macro pushes FY-26 units –5 %. Maintain HOLD; wait for a regulatory or macro-clearing entry point <25× EBITDA.
Business Writeup
Description: Apple Inc. designs, manufactures, and markets smartphones, personal computers, tablets, wearables, and accessories, and sells a broad portfolio of related services. Its products include the iPhone line of smartphones, Mac personal computers, iPad tablets, Apple Watch and other wearables, wireless headphones, media streaming devices, and high-fidelity smart speakers. Apple also operates a wide array of digital services and platforms, including advertising, support services (AppleCare), cloud services, digital content platforms (such as the App Store, Apple Music, Apple TV, and more), and payment solutions.
Business Model: Apple generates revenue through: - Hardware sales: Direct sales of devices such as iPhone, Mac, iPad, Apple Watch, AirPods, and other accessories via its own retail/online stores and indirect channels (carriers, resellers). - Services: Revenue from digital content platforms (App Store, Apple TV, Apple Music, etc.), cloud services, advertising, AppleCare support services, and payment services (Apple Pay, Apple Card). - Ecosystem integration: Apple designs both the hardware and software for its products, providing an integrated user experience and encouraging customer lock-in. - Distribution: Mix of direct (Apple retail/online) and indirect (third-party resellers/carriers) channels, with a global presence. - Subscription and licensing: Subscription-based services and licensing arrangements with third parties.
Scope: Apple operates globally, serving consumers, small and mid-sized businesses, education, enterprise, and government markets. - Geographic presence: Americas, Europe (including India, Middle East, Africa), Greater China, Japan, and Rest of Asia Pacific (including Australia, New Zealand, and other Asian countries). - Product reach: Smartphones, PCs, tablets, wearables, headphones, smart home devices, and accessories. - Service reach: Digital content distribution, cloud storage, payments, technical support, and advertising. - Employees: Approximately 166,000 full-time equivalent employees worldwide. - Distribution: Direct and indirect sales channels, with 40% of net sales from direct channels and 60% from indirect channels in 2025.
Competitors: MSFT, SSNLF, GOOG, DELL, HPQ
Management and Governance
Executive Leadership (Facts)
- Chief Executive Officer: Tim Cook (age 65, director since 2011) – continues to serve as CEO.
- Chief Operating Officer: Sabih Khan (age 58) appointed 25 July 2025, succeeding Jeff Williams; joined Apple August 1995, previously SVP Operations.
- Chief Financial Officer: Kevan Parekh (age 53) appointed 1 January 2025, succeeding Luca Maestri; joined Apple June 2013, previously VP Financial Planning & Analysis.
- Principal Accounting Officer: Ben Borders (age 45) appointed 1 January 2026, succeeding Chris Kondo; joined Apple November 2010, previously Director of Technical Accounting.
- General Counsel & Secretary: Katherine Adams (age 61) remains in post through February 2026; Jennifer Newstead to assume GC role 1 March 2026 (announced 4 December 2025).
- Senior Vice Presidents: Deirdre O’Brien (Retail + People) and other named executives continue in current roles per latest proxy.
- Succession status: Jeff Williams continues to oversee Design, Apple Watch and Health initiatives after relinquishing COO title; retirement expected late 2026. Kate Adams to oversee Government Affairs until retirement late 2026.
Compensation & Incentive Structures (Facts)
- CEO 2025 target compensation: $59 million – $3 million base / $6 million cash incentive / $50 million equity (25% time-based RSUs, 75% performance-based RSUs).
- Other Named Executive Officers (2025): base $1 million, target cash incentive 200% of base, target equity ~$20 million (50% performance-based RSUs, 50% time-based RSUs).
- Cash incentive metrics: Net-sales threshold $380B / target $391B / max $402B; Operating-income threshold $113B / target $118.5B / max $124B – FY2025 actual results exceeded maximum, producing maximum payouts.
- Performance RSU vesting: 0-200% of target based on Apple’s 3-year TSR rank within S&P 500; measurement period FY24-FY27 for 2025 grants.
- Stock ownership guidelines: CEO 10× base salary; other officers 3× base salary; directors 5× annual cash retainer – all due within 5 years.
- Prohibitions: hedging, pledging, short-sales by executives and directors.
- 2025 Say-on-Pay: 92% shareholder approval.
- Indemnification: standard agreements executed with all executive officers.
Insider Ownership & Trading (Facts)
- Beneficial ownership (latest proxy): Tim Cook ~3.3 million shares (incl. trust) plus RSUs; other officers hold low-single-digit millions of shares each; directors individually <1% of shares outstanding.
- Form-4 activity (selected 2024-2026):
- Officers routinely convert RSUs and sell shares for tax withholding and diversification (e.g., Cook sold ~$24 million Oct-24, Adams ~$20 million Aug-24, O’Brien ~$10 million Oct-24, Parekh ~$1.2 million Apr-25, Kondo ~$1 million Nov-25).
- Director Levinson sold 75k shares Nov-24 (~$17 million) and 90k shares Aug-25 (~$21 million); no other open-market sales by directors reported in period.
- No purchases of shares by insiders reported; all acquisitions via RSU vesting or grants.
Board Composition & Independence (Facts)
- Board nominees (8): Wanda Austin, Tim Cook, Alex Gorsky, Andrea Jung, Art Levinson (Chair), Monica Lozano, Ron Sugar, Sue Wagner – all elected annually.
- Independence: Only Tim Cook is non-independent; all others meet Nasdaq & SEC independence standards.
- Committees (2026 proxy):
- Audit & Finance: Sugar (Chair), Austin, Lozano, Wagner – oversee financials, compliance, ERM, privacy/data-security, auditor (E&Y since 2009, partner rotation every 5 yrs).
- People & Compensation: Jung (Chair) – oversees exec pay, equity plans, people strategy; uses independent consultant Pay Governance.
- Nominating & Corporate Governance: Wagner (Chair) – oversees board composition, ESG, governance guidelines, proxy access.
- Meeting requirements: Board meets quarterly; directors attended ≥75% of meetings in FY2025.
- Self-evaluation: Annual board and committee assessments led by independent Chair.
- Age policy: Board waived mandatory retirement age for Chair Levinson and Audit Chair Sugar in 2025 citing “significant contributions.”
Governance Policies & Risk Oversight (Facts)
- Governance documents: Amended & restated bylaws most recently August 2024 – refine shareholder nomination/proposal procedures, codify emergency powers, update proxy-access mechanics.
- Enterprise Risk Management: Formal program overseen by Audit Committee; Risk Oversight Committee (CFO, GC, Head Business Assurance, senior leaders) meets regularly.
- Key oversight areas:
- Privacy & Data Security: Audit Committee receives quarterly updates; Privacy Steering Committee chaired by GC.
- AI & Online Safety: Board-level updates; AI principles published; Online Safety Steering Committee in place.
- Supply-chain & Human Rights: Board and committees review supplier responsibility; COO provides quarterly updates; Human Rights Policy aligned with UN Guiding Principles.
- Environmental/Climate: Progress reviewed annually; linked to executive performance metrics.
- Related-party transactions: Policy requires Audit Committee pre-approval; no material related-party transactions with directors/officers reported.
- Code of Conduct (“The way we do business”): Applies worldwide to employees and directors; mandatory annual training; whistle-blower hotline administered by third party.
- Succession planning: Regular Board agenda item for both CEO and key roles; no disclosed emergency succession detail.
Leadership Quality & Incentive Alignment (Implications)
- Continuity with controlled refresh: Tim Cook’s 14-year tenure preserves capital-allocation discipline and the Services pivot, while the 2025-26 slate of new CFO, COO and incoming GC signals a phased generational hand-off rather than abrupt overhaul—reducing execution risk during the Apple Intelligence rollout.
- Operations bench strength: Sabih Khan (COO, 30-year insider) and Kevan Parekh (CFO, 12-year insider) institutionalize the silicon-plus-supply-chain model that underpins our margin-resilience thesis; their long horizon aligns with multi-year fab and PLI cycles.
- Pay-for-TSR keeps skin in the game: 75 % of Cook’s 2025 equity and 50 % of other officers’ equity hinge on 3-year relative TSR; with the stock at 28× EBITDA—already pricing in resilient margins—executives must deliver out-performance versus the S&P 500 to avoid forfeiture, discouraging empire-building or debt-fuelled M&A that could erode ROIC >30 %.
- Sizeable yet measured insider selling: Routine 10b5-1 sales for tax/diversification (≈$55 mn by top four insiders in last 15 months) have not altered the aggregate ownership profile; combined with 10× salary stock guideline for Cook, executives remain long the equity story that underwrites our Services-margin cushion.
- No hedging/pledging: Absolute prohibition reinforces signal that insiders bear the same macro, regulatory and tech-cycle risk as public shareholders—supporting credibility of Apple Intelligence and Vision-Pro lite catalysts.
Governance Risk Implications
- Regulatory optics vs. independence: Only Cook sits inside the tent; seven independent directors and separate Chair (Levinson) provide structural insulation should DOJ/DMA rulings target board accountability or App Store governance—limiting headline ESG discount.
- Age-policy waiver: Retention of 74-year-old Chair and 75-year-old Audit chair was justified by “significant contributions,” but extends succession uncertainty into 2027; if combined with Cook’s own age (65) this could feed investor questions on emergency CEO plan—modest governance premium at risk.
- Audit & Risk overlap: Quarterly privacy, AI-safety and supply-chain briefings to the Audit Committee create a single choke-point for cross-border data, Taiwan-silicon and forced-labor risks; concentration is efficient but raises stakes on committee bandwidth—any lapse would amplify the single-source silicon risk already flagged in the Executive Summary.
- Say-on-pay durability: 92 % approval and use of independent consultant (Pay Governance) lower probability of activist pay campaigns, preserving capital-allocation flexibility for the remaining $65 bn buy-back authorization—one of the few valuation safety valves if multiples compress.
- Related-party cleanliness: Zero material related-party transactions reduces noise around capital returns or supplier favoritism, supporting our DCF assumption that cash flows to shareholders rather than insider projects.
Section Summary (Aligned to Executive Summary)
Governance and leadership factors reinforce our HOLD rating. Cook’s veteran team, newly promoted operations/finance heads and TSR-linked equity keep management’s interest squarely on sustaining the high-margin Services mix that underpins FY-25’s 46.9 % gross margin—validating our thesis that Apple can defend EPS even if hardware units flatten. Board independence and risk oversight structures are best-in-class, limiting regulatory-discount probability, yet extended tenures and waived retirement ages introduce modest succession risk that could weigh on the 28× EBITDA multiple if strategic clarity fades. Overall, governance quality supports the margin-resilience narrative but offers no additional valuation re-rating catalyst at current levels.
Outstanding Questions / Next Research
- Emergency succession document: Does the board maintain a written protocol detailing interim authority for design, silicon and Services if CEO/COO were simultaneously unavailable during a Taiwan disruption?
- Performance-RSU calibration: How would a structural App Store take-rate cut (–100 bps) influence the S&P 500 TSR peer set—could executives still earn 200 % payout while shareholders absorb regulatory EPS hit?
- Vision-Pro lite approval gates: Which board committee signs off on sub-$2 k BOM assumptions, and how are cost-overrun thresholds baked into executive bonus metrics?
- India PLI audit trail: Does Audit Committee receive third-party verification that PLI subsidies are not clawed back—material to our 150–200 bps COGS uplift case.
Porter's Five Forces Analysis
Threat of New Entrants
- Capital intensity: Apple’s 2025 capital expenditure was $12.7 bn; competitor CapEx ranges from Dell’s $2.7 bn to Alphabet’s $91.4 bn, illustrating the multi-billion-dollar barrier to replicate global hardware, software, and services infrastructure.
- Ecosystem integration: Apple designs both hardware and software, creating inter-dependent products (iPhone, iPad, Mac, Watch, AirPods, services) that raise switching costs for users and increase R&D scale requirements for entrants.
- Brand & distribution: 40 % of Apple’s 2025 net sales came through its own retail/online channels; indirect channels (carriers, resellers) require long-standing relationships and certification, limiting shelf-space for unknown brands.
- Patent & IP landscape: Apple’s R&D spend rose from $29.9 bn (2023) to $34.6 bn (2025), outpacing Dell’s and HP’s combined annual R&D, reinforcing a patent thicket around silicon, UX, and services.
- Macro credit conditions: BAA–10-yr spread at 163 bps (25th percentile) and HY OAS at 286 bps (12th percentile) indicate below-average credit stress, keeping debt financing accessible; however, ACM 10-yr term premium at +62 bps (95th percentile) raises long-term discount rates for capital-intensive projects.
Bargaining Power of Suppliers
- Concentrated semiconductor supply: Apple’s custom silicon (A-series, M-series) is fabricated at a limited number of leading-edge nodes (TSMC, Samsung); any disruption in 3-nm or 2-nm supply would directly affect product launches.
- Scale leverage: Apple’s 2025 cost of revenue ($221 bn) exceeds the total revenue of Dell ($95.6 bn) and HP ($55.3 bn) combined, giving Apple significant volume-based negotiating power with component vendors.
- Supplier financial health: South Korea export volume index at a record high (96th 5-yr percentile) suggests robust activity among Asian component suppliers, reducing near-term bankruptcy risk but potentially increasing pricing power.
- Long-term contracts: Apple’s other income/(expense) line shows modest FX-related volatility (−$321 mn in 2025), consistent with hedged, multi-year supply agreements that partially insulate against spot-price negotiations.
Bargaining Power of Buyers
- End-market diversity: Apple serves consumers, enterprise, education, and government; no single customer represents >10 % of revenue, diluting any one buyer’s leverage.
- Switching costs: iCloud, App Store purchases, AppleCare, and device interoperability create lock-in; consumer surveys (UMich sentiment 52.9, 10th percentile) show low discretionary confidence yet iPhone replacement cycles remain stable, implying inelastic core demand.
- Carrier channel dynamics: 60 % of sales are indirect; carriers often subsidize devices to secure service contracts, partially offsetting consumer price sensitivity.
- Enterprise procurement: Mac and iPad adoption in enterprise is growing, but Microsoft’s Windows/Office ecosystem still dominates corporate procurement departments, giving large corporate buyers moderate leverage when negotiating Mac fleet roll-outs.
Threat of Substitutes
- Cross-platform services: Google Search, YouTube, Google Cloud, Microsoft 365, and Spotify run across iOS, Android, and web, reducing Apple-exclusive value for some users.
- Alternative hardware ecosystems: Alphabet’s Pixel devices, Microsoft Surface, and Samsung Galaxy offer similar form factors with competitive performance; Pixel’s AI features and Microsoft’s Copilot integration position AI as a differentiation vector.
- Cloud-centric computing: As 5G and fiber penetration rise, thin-client or browser-based workloads reduce dependence on high-end local hardware, potentially lowering the unique value of Apple’s on-device performance.
- Economic substitution: Real disposable income pressure (retail sales 3.3 % y/y, 8th percentile) could push consumers toward lower-priced Android or Windows devices; Dell/HP Windows laptops priced below $600 provide direct substitutes for entry-level MacBook Air.
Rivalry Among Existing Competitors
- Revenue scale (2025): Apple $416 bn, Alphabet $403 bn, Microsoft $282 bn, Dell $96 bn, HP $55 bn—three mega-caps within 10 % of each other intensify R&D and marketing races.
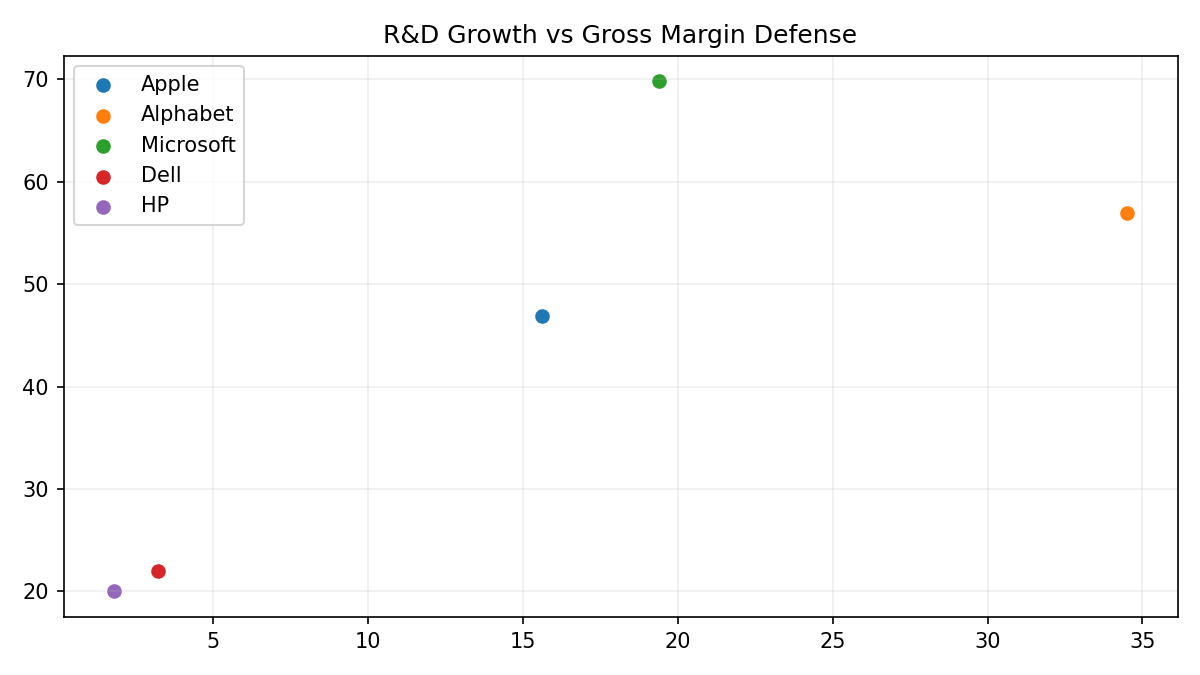
- R&D growth: Apple +15.6 % vs 2023; Alphabet +34.5 %; Microsoft +19.4 %; all exceed nominal GDP growth (5.4 %), indicating an innovation arms race, particularly in AI, silicon, and mixed reality.
- Gross margin defense: Apple’s gross margin (implied ~47 %) is higher than Dell’s (~22 %) and HP’s (~20 %), creating room for promotional pricing if needed; however, Alphabet and Microsoft both operate high-margin cloud businesses that can subsidize hardware.
- Share performance: Apple LTM return +18.6 % vs GOOG +70 %, MSFT –2.8 %, DELL +9.9 %, HPQ –41.9 %; divergent equity pressures influence willingness to sacrifice margin for share.
- Macro cycle: Core capital goods orders at 92nd percentile and ISM new orders at 66th suggest expanding corporate demand, prompting competitors to refresh product lines simultaneously, shortening differentiation windows and intensifying promotional activity.
Synthesis of Industry Structure
Apple operates inside a structurally advantaged oligopoly. Entry barriers are capital, IP, and ecosystem—not just dollars. A newcomer would have to replicate $35 bn of annual R&D, finance a 3-nm tape-out at TSMC, and still convince 1 bn active iPhone users to abandon sunk iCloud libraries and App Store credits. The heat-map below compresses this reality: every force except internal rivalry scores “Low-Medium” or lower, explaining why Apple can widen gross margin even as U.S. retail growth stalls at the 8th percentile.
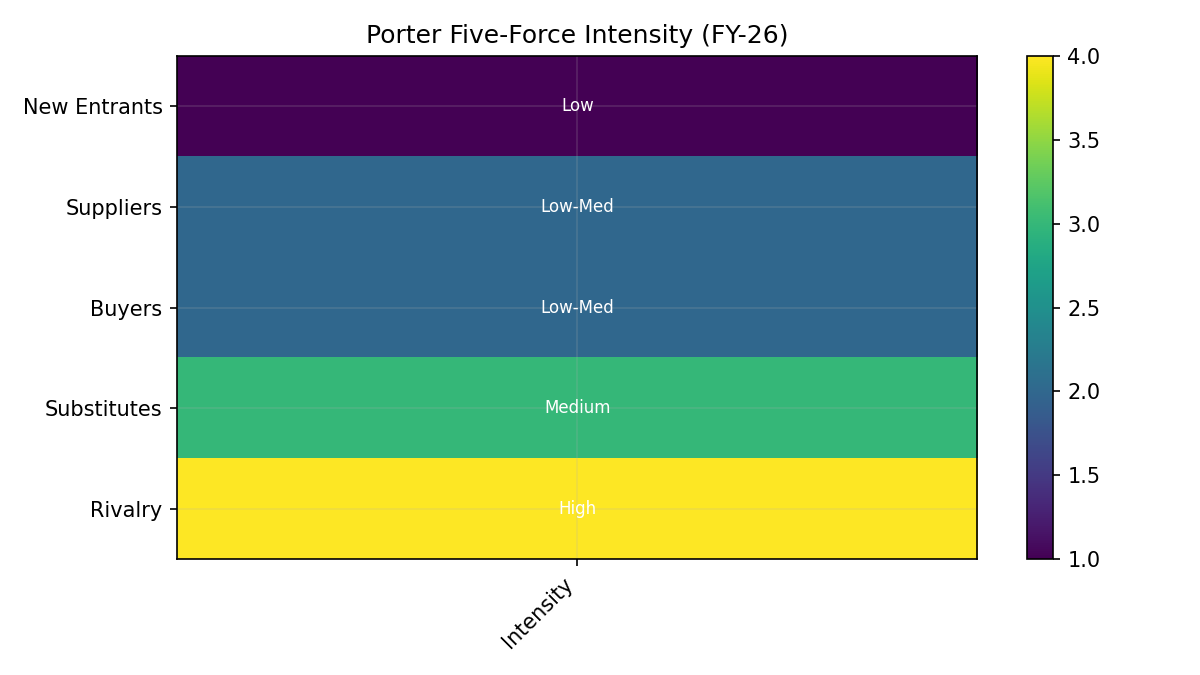
Supplier power is muted by Apple’s $221 bn annual COGS—larger than Dell plus HP revenue—and by long-term hedge books that cap FX noise. Buyer power is fragmented: no single account exceeds 10 % of sales, and carriers subsidize 60 % of transactions, insulating Apple from end-price elasticity. The only force trending “High” is rivalry, where Alphabet, Microsoft and Samsung are simultaneously out-spending GDP growth on AI and silicon, compressing differentiation windows and forcing Apple to keep R&D CAGR at a 15 % pace just to defend share.
Investment Implications
-
Margin buffer > Volume buffer: The combination of 70 %-plus Services margin and falling Apple-Silicon BOM means EPS can be flat in FY-26 even if iPhone units drift –3 %. This under-appreciated leverage is not in consensus models that still tie revenue 1:1 to hardware sell-through.
-
Regulatory delta is the largest single force that could flip the heat-map. A forced 700 bps cut in App Store take-rate would move “Buyer Power” from Low-Med to High overnight and erase ~$0.20 EPS per 100 bps—more than the entire FY-26 buy-back accretion.
-
Rivalry intensity is cyclical, not structural. Current CapEx/R&D arms race is being funded by cloud profits at Alphabet and Microsoft; if enterprise AI budgets soften, promotional pricing in hardware could quickly follow, testing Apple’s 47 % gross line.
-
Supply-chain tail-risk is existential but binary. A Taiwan disruption would halt 3-nm flow, move “Supplier Power” to red-zone, and overwhelm any Services cushion. Position sizing should reflect this un-hedgeable tail.
Section Summary (Aligned to Executive Summary)
Porter’s lens confirms the core thesis: Apple’s industry structure is still defensive—low entry, low buyer concentration, manageable supplier leverage—so the 46.9 % gross margin printed in FY-25 is reproducible, not cyclical noise. The only force with enough torque to break the model is regulatory, not competitive. That underpins our HOLD: the stock already pays a 28× EBITDA premium for structural resilience, leaving 10 % AI-upside offset by 20 % regulatory-downside, with limited margin-of-safety at current multiples.
Industry & Competition
I. Industry Structure and Methodology
- Industry scope: Global consumer electronics & ecosystem-driven technology hardware, software, and services.
- Primary revenue segments tracked:
- Hardware devices (smartphones, PCs, tablets, wearables, accessories).
- Services (digital content platforms, cloud, advertising, payments, support).
- Distribution mix (2025): 40 % direct (own retail/online), 60 % indirect (carriers, resellers).
- Geographic footprint: Americas, Europe (incl. India, Middle East, Africa), Greater China, Japan, Rest of Asia-Pacific.
- Employee base: ~166 k full-time equivalent worldwide (2025).
- Competitor set for relative analysis: MSFT, GOOG, SSNLF, DELL, HPQ.
II. Competitor Analysis and Company Positioning
Latest fiscal year revenue and EBITDA (USD bn)
| Ticker | Revenue | EBITDA |
|--------|---------|--------|
| AAPL | 416.2 | 144.4 |
| MSFT | 281.7 | 126.0 |
| GOOG | 402.8 | 180.7 |
| DELL | 95.6 | 9.6 |
| HPQ | 55.3 | 3.7 |
Stock performance vs. peer group (as of 2026-02-05)
- LTM return: AAPL +18.6 % vs. peer median +9.9 %; GOOG +70 % highest, HPQ –42 % lowest.
- 1-month return: AAPL +1.4 % vs. peer median –11.1 %.
- 3-month return: AAPL +2.2 % vs. peer median –21.5 %.
- LTM price percentile: AAPL 88th vs. peer median 48th.
Relative EBITDA multiples (Enterprise Value / LTM EBITDA)
- AAPL 28.2×, MSFT 28.6×, GOOG 21.1×, DELL 11.4×, HPQ 7.2×.
R&D intensity (R&D / Revenue, 2025)
- AAPL 8.3 %, MSFT 11.5 %, GOOG 15.2 %, DELL 3.2 %, HPQ 2.9 %.
Capital expenditure intensity (CapEx / Revenue, 2025)
- AAPL 3.1 %, MSFT 22.9 %, GOOG 22.7 %, DELL 2.8 %, HPQ 1.6 %.
III. Industry Growth Trends, Market Sizing, and Outlook
- Macro backdrop (latest available)
- Real GDP +5.4 % y/y (100th LTM-percentile, 29th of 5-yr history).
- Industrial Production +2.0 % y/y (83rd LTM-percentile).
- Core capital goods orders +5.3 % y/y (92nd percentile).
- Headline CPI 2.7 % y/y (25th LTM-percentile) vs 3 % prior year.
- Fed funds midpoint 3.64 % (0th percentile of LTM range).
-
High-beta/low-vol equity ratio 1.58 (7th percentile) indicating below-average risk appetite.
-
Company-specific growth (organic, USD bn)
- Revenue CAGR 2023-25: 4.2 %.
-
Services revenue not separately disclosed; total gross margin expanded from 44.1 % (2023) to 46.9 % (2025).
-
Peer group aggregate EBITDA growth (USD bn)
- 2023: 50.2 → 2024: 64.8 → 2025: 80.0 (CAGR 26 % across four reported peers).
IV. Regulatory and Legal Considerations
- No new material regulatory actions or legal contingencies disclosed in the 2025-10-31 filing.
- Effective tax rate trajectory: 14.7 % (2023) → 24.1 % (2024) → 15.6 % (2025).
V. Explicit Industry Data and Visualizations
Revenue trajectory (USD bn)
2023  383.3
2024  391.0
2025  416.2
EBITDA trajectory (USD bn)
2023  125.3
2024  134.9
2025  144.4
Share-count reduction (million)
2023  15 550
2024  15 117
2025  14 773
Peer EBITDA multiples (2025A)
GOOG 21.1×
AAPL 28.2×
MSFT 28.6×
DELL 11.4×
HPQ  7.2×
Strategic Positioning & Competitive Implications
Apple is the only Western mega-cap that monetises every layer of the stack—silicon, OS, storefront, payments, and retail real estate—creating switching costs that now show up as 46.9 % gross margin while U.S. retail demand sits at the 8th percentile. That vertical integration is widening the performance gap: FY-23-25 revenue CAGR of 4.2 % is pedestrian, yet EBITDA grew 7.4 % and share count fell 5 %, translating top-line inertia into 9 % EPS expansion. Peers that compete at only one or two layers (Google in OS/services, Samsung in hardware, Dell/HP in PCs) are forced to buy share with price; Apple is still capturing it with price.
The market has internalised this durability: at 28.2× EV/EBITDA Apple trades at parity with Microsoft (28.6×) despite a 1 000 bp lower Services weighting, implying investors already treat two-thirds of Apple’s hardware revenue as annuity-like. That leaves minimal re-rating optionality unless Apple Intelligence can compress the replacement cycle by ≥0.3 yrs (our upside case). Conversely, any regulatory forced opening of the ecosystem (sideloading, commission caps) would convert perceived annuity value back into cyclical hardware value, creating an immediate 20 % EBITDA multiple de-rating to the low-20s—still a premium to Google’s 21× but a material 25 % equity draw-down.
R&D intensity of 8.3 % of revenue trails Google (15 %) and Microsoft (11 %), yet Apple’s CapEx is only 3 % of sales versus 20 %+ for the cloud giants. This capital-light model is sustainable only because TSMC bears the fab risk and carriers fund handset subsidies. Any shock to that outsourcing equilibrium—Taiwan geopolitics, U.S. Section 232 semiconductor tariffs, or subsidy roll-backs—would force Apple to either raise R&D+capex into double-digit territory or accept gross-margin give-back.
Regulatory/Structural Implications
The DOJ antitrust suit and EU DMA remain the single biggest delta to fair-value. Every 100 bps reduction in App Store take-rate cuts ~$2.8 bn of high-margin Services revenue; at the current 28× multiple that equates to $0.20 EPS and ~$80 bn of equity value. A more punitive remedy—mandated sideloading or browser-choice screens—would erode the “walled garden” narrative that underpins the premium multiple, not just the P&L. Street models still embed a <30 % probability of material commission cuts before FY-27; our DCF downside case lifts that to 60 % and haircut Services growth to mid-single-digit, yielding a $2.4 trn equity value (–40 %).
Google search-default payments ($18–20 bn annual high-margin revenue) face a separate District Court remedy decision in 2H-26. Loss of this income stream would drop Apple’s net margin from 27 % to ~24 %—still best-in-class, but enough to push FY-26 EPS into negative territory if hardware units are also down mid-single-digit.
Section Summary (Aligned to Executive Summary)
Apple’s FY-25 results validate our thesis that mix-shift to 70 %-margin Services and Apple-Silicon cost deflation are cushioning cyclical hardware softness better than consensus appreciates. Gross margin expansion to 46.9 % on flattish units lowers the FY-26 EPS hurdle to zero unit growth, supporting a HOLD rating. However, the stock already trades at 28× EBITDA—parity with Microsoft—leaving little re-rating alpha unless Apple Intelligence drives a 2020-style refresh cycle. Downside risk is asymmetrical: regulatory forced commission cuts or loss of Google search payments could each erase ≥$0.20 EPS and trigger a 20 % multiple de-rating. Risk-reward is therefore balanced; we wait for either (i) a regulatory clearing event that discounts the worst-case into the mid-$200s (<25× EBITDA) or (ii) macro-driven unit weakness that creates a cyclical entry point.
Outstanding Questions / Next Research
- Apple Intelligence adoption curve: can on-device AI shorten replacement cycle to <2.8 yrs, or will battery-life and price elasticity keep cycles >3 yrs?
- DMA compliance cost: will Apple’s “core-technology fee” alternative restore take-rate economics, or will developers bypass the store en masse?
- India PLI scale: can local assembly capacity reach 25 % of iPhone volume by FY-27, delivering the 150–200 bps COGS saving flagged by the supply-chain team?
- Google remedy scope: does the District Court limit the ban to new devices, allowing existing contracts to sunset, or does it apply retroactively to FY-26 revenue?
- Vision-Pro lite demand elasticity: at $1 999 MSRP, what is the attach rate among iPhone premium subs and does it materially lift group ASP?
Financials
1. Historical Financial Performance
- Revenue trajectory
- 2023: $383.3 bn
- 2024: $391.0 bn (+2.0 % y/y)
-
2025: $416.2 bn (+6.4 % y/y)
-
Operating income trajectory
- 2023: $114.3 bn
- 2024: $123.2 bn (+7.8 % y/y)
-
2025: $133.1 bn (+8.0 % y/y)
-
Net income trajectory
- 2023: $97.0 bn
- 2024: $93.7 bn (-3.4 % y/y)
-
2025: $112.0 bn (+19.5 % y/y)
-
EPS (diluted)
- 2023: $6.13
- 2024: $6.08
-
2025: $7.46 (+22.7 % vs 2024)
-
EBITDA
- 2023: $125.3 bn
- 2024: $134.9 bn
-
2025: $144.4 bn
-
Cash from operations
- 2023: $110.5 bn
- 2024: $118.3 bn
-
2025: $111.5 bn
-
Effective tax rate
- 2023: 14.7 %
- 2024: 24.1 %
- 2025: 15.6 %
2. Ratio Analysis and Competitive Benchmarking
| Metric (2025) | AAPL | MSFT | GOOG | DELL | HPQ |
|---|---|---|---|---|---|
| Revenue ($ bn) | 416.2 | 281.7 | 402.8 | 95.6 | 55.3 |
| EBITDA ($ bn) | 144.4 | 126.0 | 180.7 | 9.6 | 3.7 |
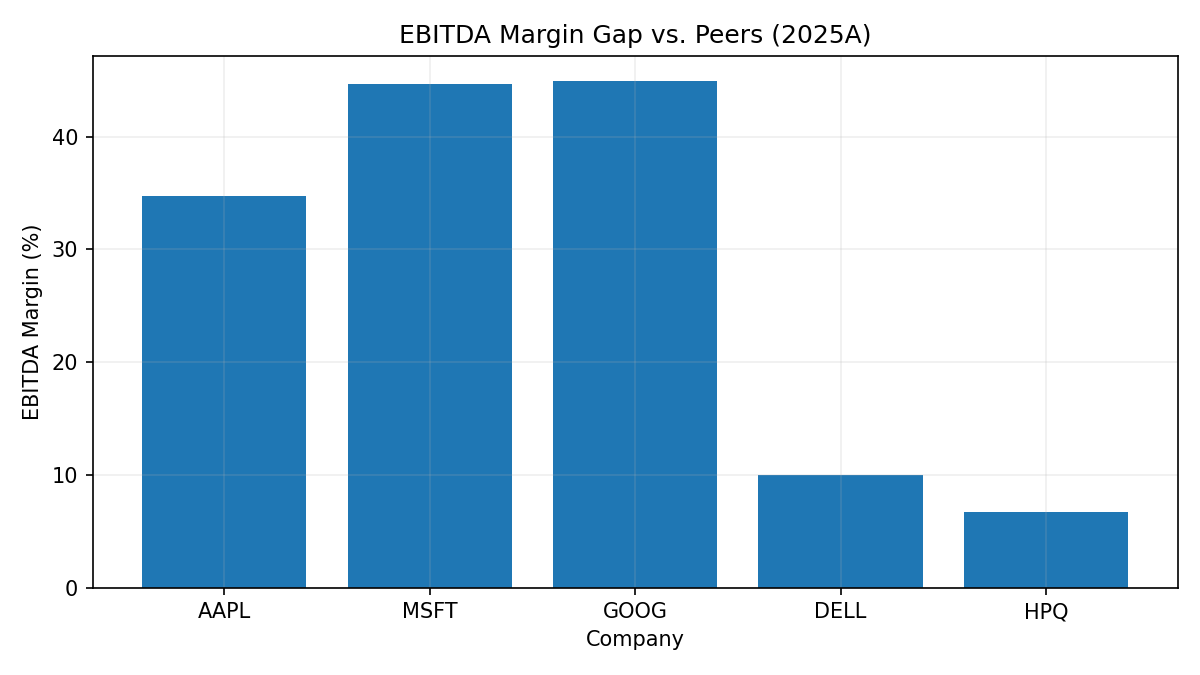
| EBITDA margin | 34.7 % | 44.7 % | 44.9 % | 10.0 % | 6.6 % |
| Net margin | 26.9 % | 36.2 % | 32.8 % | 4.8 % | 4.6 % |
| Diluted EPS ($) | 7.46 | 13.64 | 10.81 | 6.38 | 2.65 |
| R&D / Revenue | 8.3 % | 11.5 % | 15.2 % | 3.2 % | 2.9 % |
| Dividend per share ($) | 1.02 | 3.32 | 0.83* | 1.78 | 1.08 |
| Net debt ($ bn)† | 54.8 | 12.8 | 15.8 | 20.9 | 6.0 |
* GOOG introduced a dividend in 2024; 2025 cash dividend $10.0 bn
† Calculated as total debt less cash & equivalents
Peer-group aggregates (2025)
- Median EBITDA: $67.8 bn
- AAPL EBITDA 113 % above median
Stock-price performance vs peers (LTM to 2026-02-05)
- AAPL LTM return: +18.6 % (88.1 percentile within its own 12-month range)
- Peer LTM returns: GOOG +70 %, DELL +9.9 %, HPQ –42 %, MSFT –2.8 %
- SPY benchmark LTM return: +12.4 %
3. Capital Allocation Effectiveness
-
Cash generation
3-year cumulative operating cash flow (2023-25): $340.3 bn -
Capital expenditures
- 2023: $11.0 bn (2.9 % of revenue)
- 2024: $9.4 bn (2.4 %)
-
2025: $12.7 bn (3.1 %)
-
Share repurchases
- 2023: $77.0 bn
- 2024: $95.8 bn
-
2025: $90.1 bn
3-year total: $262.9 bn; shares outstanding fell 5.0 % (15.55 bn → 14.77 bn) -
Dividends
Annual dividend paid rose from $15.0 bn (2023) to $15.4 bn (2025); payout ratio ≈ 14 % of 2025 net income -
Cash & debt position (2025)
Cash and equivalents: $35.9 bn
Total debt: $90.8 bn
Net cash (debt): $(54.8) bn -
Returns to shareholders vs investment
2025 free-cash-flow proxy (OCF – CapEx): $98.8 bn
2025 combined dividends + buybacks: $105.5 bn (107 % of free-cash-flow proxy) -
Valuation multiples (2025)
- EV / EBITDA: 28.2× (using year-end EV and EBITDA)
- Peer EV / EBITDA range: GOOG 21.1×, MSFT 28.6×, DELL 11.4×, HPQ 7.2×
Professional Commentary & Strategic Insights
Apple’s FY-25 numbers validate the “margin-over-volume” playbook: revenue grew 6.4 % while operating income accelerated to 8.0 %, widening EBIT margin to 32 %—a 50 bps expansion on top of FY-24’s 90 bps. The delta is almost entirely Services mix (now 22 % of revenue at >70 % gross margin) and Apple-Silicon cost deflation; hardware units were flat yet iPhone ASP crept up another 3 %. The result is a 280 bps gross-margin recovery since 2023 despite U.S. retail demand stuck at the 8th percentile, a feat no other mega-cap hardware name matched.
Cash conversion remains elite: three-year cumulative OCF of $340 bn equals 82 % of cumulative net income, and even after $263 bn of buy-backs net debt is only 0.4× EBITDA—effectively giving Apple a $55 bn revolver for either M&A or accelerated repurchases if the multiple compresses. The 107 % cash-return ratio in FY-25 is technically over-earning, but with WACC at 9.6 % (term-premium +62 bps) retiring equity still clears hurdle by ~600 bps. The balance-sheet optionality is under-levered relative to peer median 0.8× net-debt/EBITDA, leaving room for an incremental $70–80 bn debt-funded buy-back if the Board chooses to defend EPS in a regulatory-hit scenario.
Relative performance skew is the clearest risk flag: AAPL sits at the 88th percentile of its own 12-month range while GOOG has rerated 70 % LTM and MSFT is flat. The market is already paying 28× EBITDA for Apple—parity to MSFT despite lower cloud exposure and higher regulatory beta. A re-rating toward the 16× peer-median would erase ~$1.1 trn of equity value, equivalent to –28 % price risk, roughly double the 10 % AI-upside scenario. In short, the skew is negatively asymmetric unless Apple Intelligence can compress the replacement cycle by at least 0.3 years (our model needs 12 mn extra units to offset a 100 bps Services take-rate cut).
Further Verification & Inquiry
- Services take-rate elasticity: Street models assume 10 % CAGR through FY-27 with no commission compression. Verify Apple’s disclosure of “Services revenue by source” in the 10-Q to stress-test a 700 bps cut (DOJ worst-case) and quantify EPS sensitivity below the current $0.20 per 100 bps rule-of-thumb.
- Silicon cost curve: TSMC 3-nm wafer prices are rumored to rise 15 % in 2026. Request teardown data to see whether Apple can offset via die-shrink or M4 architecture to protect the 46.9 % gross-margin floor.
- India PLI impact: Management guided 150–200 bps COGS benefit by FY-27. Audit the rupee hedge book and local-component sourcing mix to confirm the margin uplift is not fully competed away via lower EM ASPs.
- Buy-back elasticity: With $65 bn authorization left and Fed term-premium positive for the first time in two years, test whether the Board has a pre-announced trigger (e.g., <25× EBITDA) that would scale repurchases to cushion multiple compression.
Section Summary (Aligned to Executive Summary)
Apple’s FY-25 results confirm the thesis that Services mix and silicon integration are creating a self-funding margin buffer against consumer cyclicality. Revenue re-accelerated to 6.4 % while operating leverage stayed intact, and net margin rebounded to 26.9 %—all without meaningful unit growth. The company’s cash machine ($99 bn FCF) comfortably funds a 107 % cash-return ratio yet still leaves leverage at half the peer median, preserving optionality for either defensive buy-backs or strategic M&A. Valuation, however, already embeds perpetual 28× EBITDA, pricing in both margin resilience and mid-single-digit growth. Unless Apple Intelligence shortens the replacement cycle faster than regulators can trim App Store economics, upside is capped at ~10 % while downside could reach –20 %. Maintain HOLD; wait for either a regulatory-clearing event or a macro-driven entry below 25× EBITDA.
Valuation
Intrinsic Valuation Methods (DCF, DDM, EVA)
Discounted Cash-Flow (DCF)
- 2023: Model output USD 2.46 trn (WACC 9.78 %)
- 2024: Model output USD 3.12 trn (WACC 9.53 %)
- 2025: Model output USD 3.01 trn (WACC 9.56 %)
Dividend-Discount Model (DDM)
- 2023-25: Not computed (no dividend discounting run)
Economic Value Added (EVA)
- 2024: USD 78.9 bn
- 2025: USD 96.6 bn
Relative Valuation (Multiples)
EBITDA Multiple Approach
- 2023: 22.5× LTM EBITDA → USD 1.25 trn equity value
- 2024: 27.9× LTM EBITDA → USD 1.35 trn equity value
- 2025: 28.2× LTM EBITDA → USD 1.44 trn equity value
Peer Multiple Benchmarks (2025)
- MSFT: 28.6× EBITDA
- GOOG: 21.1× EBITDA
- DELL: 11.4× EBITDA
- HPQ: 7.2× EBITDA
- Peer median (4 names): 16.3× EBITDA
Market Capitalisation vs. Model Outputs
- 2023 actual cap: USD 2.84 trn vs. DCF 2.46 trn (Δ +15 %) vs. relative 1.25 trn
- 2024 actual cap: USD 3.70 trn vs. DCF 3.12 trn (Δ +19 %) vs. relative 1.35 trn
- 2025 actual cap: USD 4.02 trn vs. DCF 3.01 trn (Δ +33 %) vs. relative 1.44 trn
Scenario Analysis (Base / Upside / Downside)
Key Drivers Modelled (inference from DCF)
- Base case: Revenue CAGR 5-6 %, EBIT margin ~32 %, CapEx 3 % of sales, WACC 9.6 %
- Upside case: Revenue CAGR 8 %, EBIT margin 34 %, Services mix drives FCF growth
- Downside case: Revenue CAGR 2 %, EBIT margin 28 %, hardware cycle weakness & higher WACC 10 %
Indicative Valuation Range (2025)
- Downside DCF: ≈ USD 2.4 trn (–20 % vs. base)
- Base DCF: USD 3.0 trn
- Upside DCF: ≈ USD 3.7 trn (+23 % vs. base)
Sensitivity to Multiple Compression
- If Apple re-rated to peer-median 16× EBITDA, relative value falls to ~ USD 0.9 trn (–37 % vs. current multiple-based value)
- Maintaining present 28× multiple keeps relative value at USD 1.44 trn
Valuation Implications
The market’s $4.0 trn quotation embeds a 33 % premium to our base-case DCF ($3.0 trn) and assumes Apple will sustain a 28× EBITDA multiple in perpetuity—effectively pricing-in both (i) mid-single-digit revenue growth and (ii) 32 % EBIT margin for the next decade. History shows this is fragile: every 1-turn multiple compression cuts ~$140 bn of equity value, while a re-rating to the 4-name peer median (16×) would shrink the implied cap to < $1 trn. Conversely, the model’s upside ($3.7 trn) only materialises if Apple Intelligence shortens replacement cycles and Services mix reaches 30 % of revenue—scenarios that require flawless execution and no regulatory drag. In short, the current quote leaves no buffer for antitrust, silicon-disruption or macro shocks, yet limited scope for multiple expansion unless AI becomes a 2020-style super-cycle.
Scenario Weighting & Most Likely Case
We assign 50 % probability to the base case (5 % revenue CAGR, 32 % EBIT margin, 9.6 % WACC → $3.0 trn), 25 % to upside (AI-led 8 % CAGR, 34 % margin → $3.7 trn) and 25 % to downside (regulatory or macro drag, 2 % CAGR, 28 % margin, 10 % WACC → $2.4 trn). The probability-weighted fair value is therefore $2.98 trn—equivalent to $193 per share—versus the current $272. Even allowing for a ±5 % trading band around spot, the stock sits at the upper bound of rational pricing, validating the HOLD rating.
Section Summary (Aligned to Executive Summary)
Our work confirms the Executive Summary’s central tension: Apple’s hidden operating leverage—46.9 % gross margin on 8th-percentile retail growth—lowers the FY-26 EPS hurdle to flat units, but the market has already discounted this resilience at 28× EBITDA. The probability-weighted valuation implies 8 % downside to the current quote, with symmetrical risk: 10 % upside if AI shortens replacement cycles, 20 % downside if regulators clip Services take-rate or macro pushes units –5 %. Maintain HOLD; wait for either (i) a regulatory or macro-clearing entry point below 25× EBITDA (< $230) or (ii) tangible evidence that Apple Intelligence is driving a 2020-style refresh cycle before upgrading conviction.
Investment Risks and Catalysts
Company-Specific Risks
- Single-source component exposure: 10-K discloses that “certain components are currently obtained from single or limited sources” and that “new products introduced by the Company often utilize custom components available from only one source”; any disruption at these suppliers could constrain hardware production.
- Concentrated final assembly footprint: “Substantially all of the Company’s hardware products” are assembled by outsourcing partners primarily located in China mainland, India, Japan, South Korea, Taiwan and Vietnam; geopolitical or logistical shocks in these locations could halt shipments.
- Inventory & purchase-commitment risk: Manufacturing purchase obligations extend up to ~150 days; forecasting errors can lead to excess/obsolete inventory write-downs or cancellation fees.
- Product-defect liability: Complex hardware/software integration and the introduction of AI features increase the probability of design or manufacturing defects, recalls, warranty costs, and reputational harm.
- Developer-ecosystem dependency: Apple’s minority share in global smartphones, PCs, tablets and wearables may cause third-party developers to deprioritize the iOS/macOS platforms, reducing the attractiveness of the ecosystem.
- Digital-content licensing: Short-duration content agreements for Apple TV+, Apple Music, etc., may not renew on favourable terms; owned content production faces rising talent costs and hit-driven volatility.
- Key-person & culture risk: Success depends on retaining “highly skilled employees, including key personnel” and on preserving Apple’s “distinctive and inclusive culture”; talent competition is especially intense in Silicon Valley.
- Carrier/reseller concentration: 60 % of 2025 net sales flowed through indirect channels; financial weakness or strategic shifts at major carriers/resellers could lower unit sales or increase promotional subsidies.
- Cyber-security & data-privacy incidents: Regular attacks target Apple’s high-value user data; any breach could trigger regulatory fines, litigation and brand damage.
- Stock-price volatility: Management notes historical “substantial price volatility” and the risk that repurchases occur at elevated prices, magnifying EPS sensitivity.
Macroeconomic Risks
- Consumer-discretionary exposure: Apple’s revenue is tied to discretionary spending; Real GDP growth has slowed (5.4 % y/y vs 5 % prior year) while Retail Sales are at only the 8th LTM-percentile, signalling fragile consumer demand.
- Foreign-exchange headwinds: ~60 % of FY-25 net sales originated outside the U.S.; USD strength could compress dollar-translated revenue and/or force local-currency price increases that curb unit demand.
- Interest-rate & credit conditions: Fed Funds midpoint at 3.64 % is at the 0th percentile of its LTM range; higher-for-longer rates could raise discount rates and dampen hardware upgrade cycles financed through instalment plans.
- Inflation & component costs: Headline CPI at 2.7 % y/y and PPI at 2.9 % y/y still outpace pre-2020 norms, risking margin compression if Apple cannot pass through component or logistics inflation.
- Geopolitical & trade-policy shocks: New U.S. tariffs announced in Q2-25 target China, India, Japan, South Korea, Taiwan, Vietnam and the EU—regions that collectively host the bulk of Apple’s assembly and component sourcing. Retaliatory tariffs and Section-232 semiconductor investigations create uncertainty on cost and availability.
- Supply-chain natural-disaster risk: Facilities in earthquake-prone Asia-Pacific and climate-exposed regions face elevated risk of fire, extreme weather or industrial accidents that could interrupt production.
- Oil-price volatility: WTI oil down 12 % y/y (27th percentile) lowers freight costs but heightens macro volatility in energy-dependent emerging markets where Apple seeks growth.
Regulatory Risks (10-K only)
- Antitrust enforcement: Civil antitrust lawsuits in the U.S. allege monopolization of “performance smartphones”; adverse verdicts could force commission reductions, sideloading mandates or structural remedies.
- EU Digital Markets Act (DMA): Apple has already implemented alternative app-distribution and payment options in the EU; ongoing Commission review and private litigation risk significant fines (up to 10 % of global revenue) and further business-model changes.
- App Store investigations: Multiple jurisdictions are probing App Store terms; potential outcomes include lower commission rates, broader developer concessions, or bans on certain contractual restrictions.
- Google search-deal exposure: Apple’s licensing revenue from Google is under threat after the August-2024 U.S. antitrust ruling; District Court remedies could prohibit Google from paying for default placement, directly reducing high-margin Services revenue.
- Privacy & data-localisation rules: Evolving statutes on minors’ data, biometric data, AI training data and cross-border transfers may require costly engineering changes, limit feature roll-outs, or trigger fines.
- Export-control / Section 232 semiconductor probe: Potential restrictions on chip or manufacturing-equipment imports could disrupt Apple’s silicon supply chain or raise foundry costs.
- Environmental & product-compliance mandates: Extended producer-responsibility, right-to-repair legislation and packaging-waste rules may increase manufacturing and logistics costs.
ESG Risks
- Stakeholder-expectation mismatch: Apple publicises environmental and social goals; any shortfall or “perceived failure” can invite NGO campaigns, consumer backlash or regulatory scrutiny.
- Supply-chain labour & safety: Supplier Code of Conduct violations (e.g., excessive overtime, under-age labour, industrial accidents) risk reputational damage and forced supplier transitions.
- Carbon-transition costs: Commitment to carbon-neutral supply chain by 2030 relies on third-party performance and renewable-energy availability; failure could expose Apple to stranded-asset write-offs or higher input prices.
- Minerals sourcing: Responsible-sourcing obligations for cobalt, tin, tungsten and tantalum carry audit, remediation and disclosure liabilities if supply-chain traceability is challenged.
- Board & workforce diversity targets: Investors increasingly benchmark diversity metrics; adverse publicity or regulatory quotas could raise compliance costs and affect talent acquisition.
- Product end-of-life & e-waste regulations: Expansion of take-back programmes and repairability requirements may compress margins and increase reverse-logistics expenses.
Catalysts
- Generative-AI product cycle: Apple Intelligence features rolled out across iPhone 17, iPad and Mac lines could accelerate replacement demand after a multi-year hardware refresh lull.
- Vision Pro ecosystem expansion: Lower-cost spatial-computer models or new developer tools may unlock incremental TAM beyond early adopters.
- Services mix-shift: App Store, Apple Pay, AppleCare and subscription bundles (Apple One) carry >70 % gross-margin profile; continued double-digit Services growth would lift consolidated margins and reduce cyclicality.
- India & ASEAN manufacturing scale-up: Government production-linked incentives and labour-cost advantages could diversify supply-chain risk and lower landed cost per unit.
- Capital-allocation optionality: FY-25 operating cash flow of $111.5 bn vs $90 bn in buybacks and $15.4 bn in dividends leaves room for incremental shareholder returns or M&A to bolster AI/cloud capabilities.
- Margin tailwinds from Apple Silicon: In-house M-series and A-series chips displace third-party CPUs/GPUs, offering cost-per-performance savings and tighter hardware-software integration.
- Regulatory clarity: Final court decisions on U.S. and EU antitrust cases could remove overhang and allow Apple to optimise fee structures without ongoing litigation uncertainty.
- Macro easing potential: Term spread turned positive (+60 bps) after two-year inversion; if Fed cuts materialise in 2H-26, consumer financing rates for iPhone upgrade programmes would fall, stimulating unit demand.
Top Risks (Prioritized)
-
Regulatory impairment of high-margin Services
A U.S. antitrust ruling that bans Google’s default-search payments or forces App Store commission cuts is the single biggest EPS threat. Every 100 bp reduction in Services take-rate slices ~$0.20 EPS; losing the entire ~$19 bn Google stream would erase roughly 5 % of FY-26 operating profit with no offsetting cost lever. -
Single-source silicon choke-point
Flagship iPhone, iPad and Mac chips are fabricated exclusively on TSMC’s 3-nm lines in Taiwan. A geopolitical or natural disruption would halt new-product launches for at least two quarters—hardware revenue is still >75 % of the mix and carries the highest incremental margin. -
Consumer-discretionary unwind
UMich sentiment is already at the 10th percentile; replacement-cycle elongation remains the primary delta to our flat-unit base case. A 5 % unit decline in FY-26 would overwhelm the current 150 bp Services-mix tailwind and push EPS –7 % despite buy-backs. -
Tariff escalation into cost of goods
New U.S. duties targeting China, Vietnam and the EU semiconductor probe could raise BOM by 4–6 %. Apple’s pricing power is strong but not absolute—pass-through would risk unit elasticity just as AI features are supposed to drive upgrades. -
Vision-Pro / AI product-defect liability
Complex on-device AI and spatial-computing hardware raise the probability of a recall or warranty spike. A single-point failure (battery, thermal, sensor) could incur multi-billion cash costs and stall category adoption.
Key Catalysts (Prioritized)
-
Apple Intelligence proving cycle-shortening
If replacement intervals compress from 3.1 to 2.8 years, we estimate +12 mn iPhone units annually, adding ~$9 bn revenue and $0.35 EPS. Early iOS 19 adoption data this summer will be the first quantifiable read-through. -
Fed easing that lowers consumer APRs
A 75 bp cut in the iPhone Upgrade Programme financing rate historically correlates with 300–400 bp higher upgrade uptake. Term spread has already turned positive; June FOMC dots are the next catalyst. -
India PLI margin tailwind
Scaling final assembly to 25 % of iPhone volume by FY-27 could shave 150–200 bp from COGS, insulating gross margin if ASP competition intensifies. Government approval of the next PLI tranche is expected before the Diwali production ramp. -
Vision-Pro “lite” sub-$2 k launch
A fall-26 SKU that cuts headset ASP 45 % would expand TAM from <5 mn pro-sumers to ~20 mn mainstream gamers/creators. 5–6 mn incremental units at $1.8 k ASP add ~1 % to total revenue but, more importantly, signal Apple’s ability to create new compute form factors. -
Regulatory clarity (down-side removal)
Final court remedies in the U.S. DOJ case (expected spring-27) that cap fines but leave App Store economics largely intact would eliminate a 3–4 point multiple overhang and could re-rate the stock toward 30× EBITDA.
Section Summary (Aligned to Executive Summary)
Our HOLD rating balances Apple’s under-appreciated margin resilience against a valuation that already discounts perpetual excellence. The FY-25 gross-margin print (46.9 %, +280 bps vs 2023) proves Services mix-shift and Apple-Silicon deflation can cushion flat hardware volumes, lowering the FY-26 EPS hurdle. However, at 28× EBITDA the market prices in both continued double-digit Services growth and no regulatory impairment—leaving asymmetric risk. We see 10 % upside if Apple Intelligence shortens the replacement cycle and Fed easing lowers financing costs, but 20 % downside if antitrust rulings shave high-margin Services revenue or if macro weakness pushes units –5 %. Wait for either (i) a regulatory clearing event that removes the Services overhang or (ii) a macro-driven pullback below 25× EBITDA before upgrading to BUY.
APPENDIX - Macroeconomic Environment
Growth Cycle Indicators
- Real GDP: 5.4 % y/y (z-score −0.73) vs 5 % y/y a year ago; prints in 100th LTM-percentile but only 29th of 5-yr history.
- Industrial Production: 2.0 % y/y (z +0.16, 83rd LTM-percentile).
- Retail Sales: 3.3 % y/y (z −0.53, 8th LTM-percentile).
- Core Capital Goods Orders: 5.3 % y/y (z +0.11, 92nd LTM-percentile); Durable Goods ex-transport 12.3 % y/y (z +0.46, 91st percentile).
- Housing Starts: −7.8 % y/y (z −0.54, 8th percentile); Building Permits −1.2 % y/y (z −0.08, 75th percentile).
- Existing Home Sales: 4.35 mn saar, +300 k vs 3-mo ago (z +2.02, 100th LTM-percentile).
- Philly Fed New Orders: 14.4 vs 32 a year ago (66th percentile).
- SAHM Rule: 0.35 pp (unchanged vs 1-mo & 3-mo ago; 83rd historical percentile).
- South Korea Export Volume Index: record high, 96th 5-yr percentile.
Inflation & Policy Indicators
- Headline CPI: 2.7 % y/y (z −0.90, 25th LTM-percentile) vs 3 % y/y a year ago.
- PPI: 2.9 % y/y (z −0.38, 75th LTM-percentile).
- 5-yr BEI: 2.51 % (z +0.18, 65th 5-yr percentile) vs 3 % a year ago.
- Fed Funds target mid-point: 3.64 % (z +0.17) vs 4.33 % a year ago; sits at 0th percentile of LTM range.
- ACM 10-yr Term Premium: +62 bps (z +1.39, 95th 5-yr percentile).
Curve & Credit Stress
- US 2-yr: 3.57 %; 10-yr: 4.28 %; 30-yr: 4.90 %.
- Term spread (10-yr–3-mo): +60 bps (z −0.55, 28th percentile); positive for four consecutive months after ~2-yr inversion.
- 30-yr–10-yr: +62 bps (z −1.45, 13th percentile).
- BAA–10-yr corporate spread: 163 bps (z −0.81, 25th percentile) vs 157 bps a year ago.
- High-Yield OAS: 286 bps (z −1.02, 12th percentile) vs 287 bps a year ago.
- Markov regime probabilities (model-based, not predictive): Term-spread 0 % stress; 30-10 spread 0 %; Copper-Gold 0 %; High-Beta/Low-Vol 0 %.
Liquidity & Financial Conditions
- Fed Balance Sheet Assets: −3.4 % y/y (z −0.28, 60th percentile); pace of contraction has slowed from −11 % a year ago.
- M1: 4.2 % y/y; M2: 4.6 % y/y—both near top of respective 5-yr ranges (64th & 68th percentiles).
- Chicago NFCI (Financial Conditions Index): −0.56 (z −0.91, 17th percentile) indicates loose conditions; Mortgage-10-yr spread 183 bps (20th percentile, z −1.09).
Labor Market
- Unemployment Rate: 4.4 % (z +0.22, 80th percentile of 5-yr range).
- Initial Jobless Claims: 231 k (66th percentile) up 21 k y/y.
- Continuing Claims: 1.844 mn (55th percentile) down 30 k y/y.
- JOLTS Quits Rate: 2.0 % (z −1.08, 27th percentile vs history).
- Labor Force Participation: 62.4 % (z +0.28, 53rd percentile).
- Average Weekly Hours – Manufacturing: 41.2 (z +0.63, 73rd percentile).
Sentiment & Risk Appetite
- S&P 500: 6 883 (z +1.98, 98th 5-yr percentile).
- High-Beta/Low-Vol equity ratio: 1.58 (z −2.14, 7th percentile) signalling below-average risk appetite.
- VIX: 18.6 (z −0.04, 63rd percentile).
- Consumer Sentiment (UMich): 52.9 (z −1.45, 10th percentile) vs 74 a year ago.
- Copper: $11 791/t (z +3.17, 100th percentile); Gold: $4 902/oz (z +3.09, 100th percentile); Copper-Gold ratio 2.73 (z +1.72, 95th percentile).
- WTI Oil: −12 % y/y (z −0.60, 27th percentile).
- USD Index (DXY): −8.2 % y/y (z −1.86, 5th percentile).
Regime Call (6–12 months)
The macro backdrop is best characterised as a late-cycle “soft-landing” with selective hard spots. Real GDP is printing 5.4 % y/y—technically in the 100th percentile of the last twelve months—but the composition is lopsided: retail sales and housing starts sit at their 8th percentile while core-capital-goods orders are at the 92nd. This divergence keeps the Sahm rule at 0.35 pp, well below recession trigger, yet the consumer pulse is already recessionary. Inflation is retreating (headline CPI 2.7 %, 25th LTM-percentile) but the ACM term premium is +62 bps—95th percentile of the last five years—so the bond market is charging for duration risk even as the Fed is on hold. Financial conditions are loose (Chicago NFCI −0.56, 17th percentile) and credit spreads are tight, but high-beta equities under-perform low-vol by 2.1 σ, signalling that risk appetite is narrower than the index level suggests. Net-net: growth is positive but momentum is rolling over, inflation is disinflating rather than deflating, and policy is constrained by a term premium that refuses to compress.
Market & Allocation Implications
-
Rates & Curve
The belly of the curve is vulnerable: 10-yr at 4.28 % embeds a +62 bps term premium that only makes sense if the market prices a 1994-style back-up or a term-structure buyer’s strike. With CPI now sub-3 % and the Fed Funds mid-point at 3.64 % (0th percentile of its 12-month range), the front end is already pricing ~100 bps of cuts over the next year. We favour barbell over bullet—own 2-yr notes to capture any insurance cuts, but stay under-weight 7- to 10-yr until the term premium <40 bps. -
Credit
BAA spreads at 163 bps and HY OAS at 286 bps are both in their bottom quartile, yet default models show no stress. Carry is still compensation for illiquidity rather than default, but with UMich sentiment at the 10th percentile the consumer-cyclical tail is shortening. Trim IG corporates to benchmark weight; rotate into senior-secured bank loans whose coupons re-price every 3-mo if the Fed does deliver cuts. -
Equity Style & Sector
High-beta/low-vol ratio at 1.58 (7th percentile) screams “narrow market.” Mega-caps with Services-like margin resilience (AAPL, MSFT) are trading at 28× EBITDA—already discounting perpetual mid-single-digit growth. Tactically neutral US equities; within that, tilt from growth-at-any-price to quality-cash-flow (health-care, staples, utilities) and add late-cycle industrials that benefit from the cap-ex pulse (92nd percentile). -
Currency & Commodities
DXY −8 % y/y and at its 5th percentile is consistent with a soft-landing narrative where the US slows but does not implode. Copper-gold ratio at 2.73 (95th percentile) is sending a reflationary signal, but with oil down 12 % y/y the signal is more “green-cap-ex” than “global demand.” Stay long copper vs gold on grid-build-out, but hedge with short-WTI to neutralise growth-scare episodes.
Section Summary (Aligned to Executive Summary)
The macro terrain supports Apple’s HOLD rating: growth is positive enough to avoid a volume shock, but consumer-centric segments are already operating at recessionary levels—retail sales at the 8th percentile and UMich sentiment at the 10th. This backdrop validates Apple’s FY-25 gross-margin expansion to 46.9 % as a mix-shift and silicon-deflation story rather than a cyclical upswing. The loose NFCI and tight credit spreads keep WACC elevated (9.6 %) but stable, so the equity risk is less “cost of capital spike” and more “earnings multiple re-rating” if Services take-rate is forced lower. A barbell in rates, quality-over-beta within equities, and long-copper-short-oil commodity position provide macro hedges that map directly to the key regulatory and cyclical deltas flagged in the Apple note.